Synthesis: Three Frameworks, One Answer
This is the final post in a series on Himalayan mountaineering data. The previous posts built up three analytical frameworks: Bayesian hierarchical models, probabilistic graphical models, and causal inference. Here I'll synthesize the findings—what converges, what diverges, and what we learn from triangulation.
The central question throughout: does supplemental oxygen cause higher summit success? Each framework approaches this differently. Convergence across methods strengthens our confidence in the answer.
The Three Frameworks
Each analytical approach brings different strengths:
| Framework | Core Question | Key Strength |
|---|---|---|
| Bayesian Regression | What predicts success? | Principled uncertainty |
| Graphical Models | What's the structure? | Explicit causal DAG |
| Causal Inference | What's the causal effect? | Confounding adjustment |
The goal isn't to pick a winner—it's to use each framework for what it does best, then look for agreement.
Effect Estimates: Convergence
The headline finding: all methods agree oxygen helps, substantially.
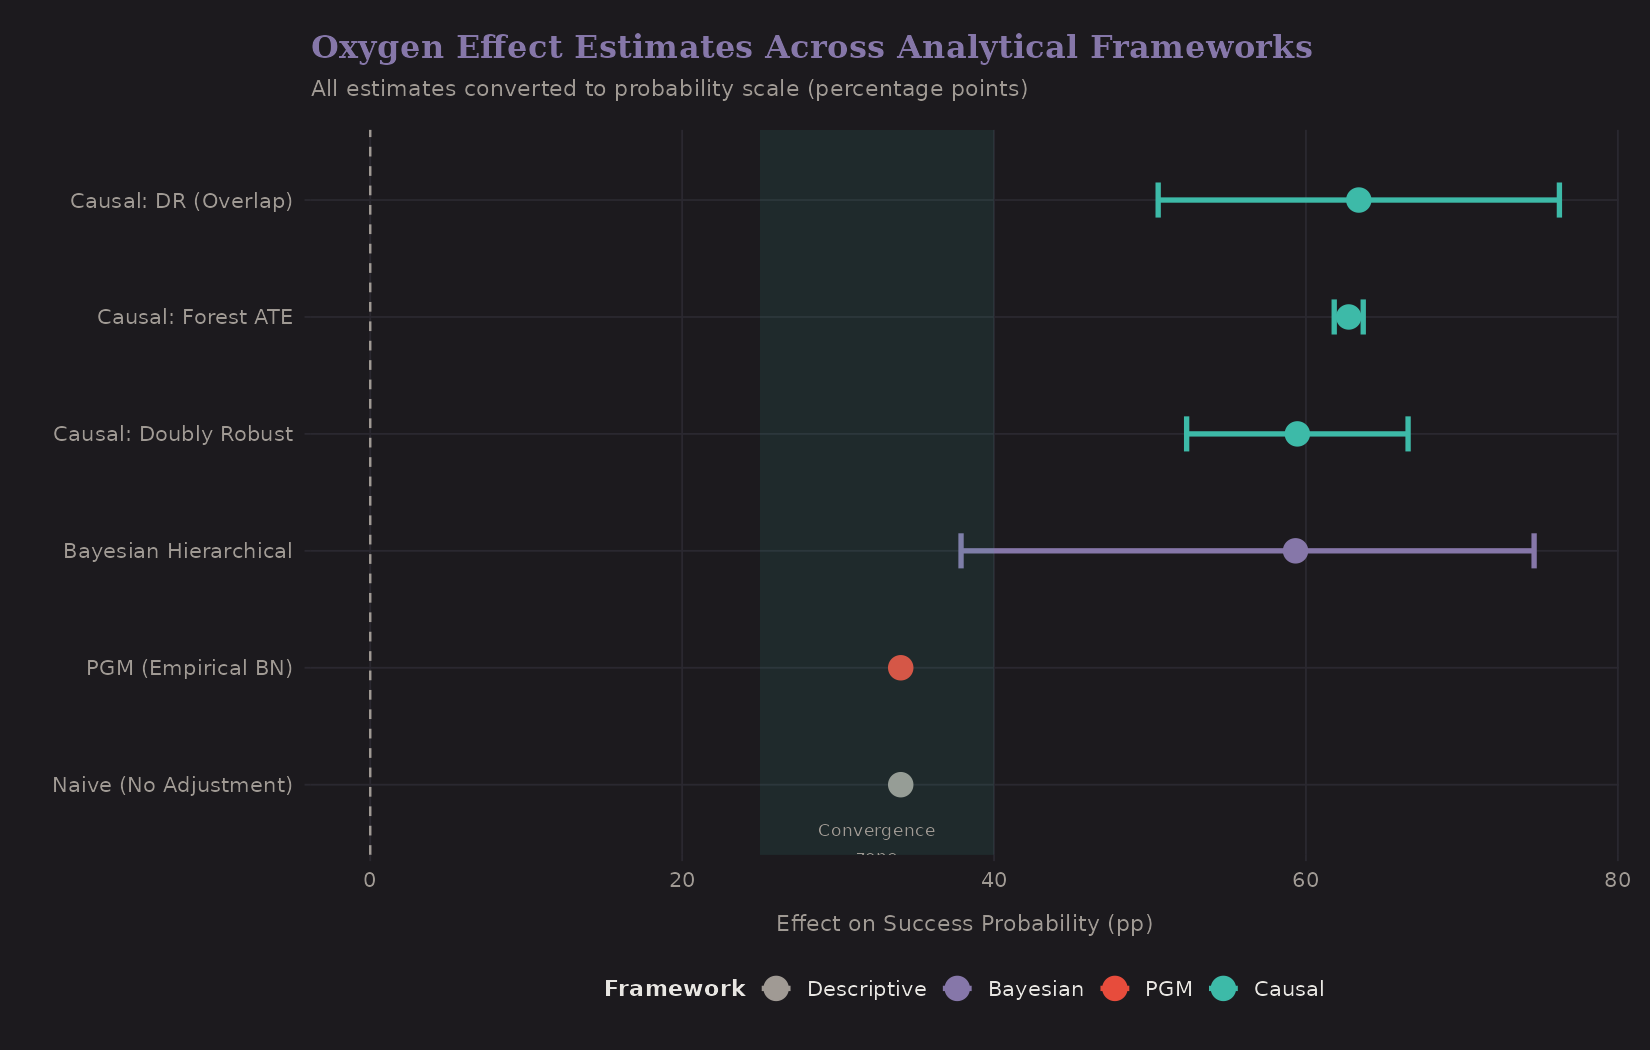
| Method | Estimate | 95% CI | Type |
|---|---|---|---|
| Naive (unadjusted) | +34 pp | — | Confounded |
| Bayesian Hierarchical | +59 pp | [38, 75] | Association |
| Doubly Robust | +59 pp | [52, 67] | Causal (ATE) |
| Overlap-Restricted (DR) | +63 pp | [51, 76] | Causal (ATE, trimmed) |
| Causal Forest | +63 pp | [62, 64] | Causal (CATE) |
The naive estimate (+34 pp) is actually lower than the adjusted estimates. This is counterintuitive—usually confounding inflates effects. Here, it suppresses them.
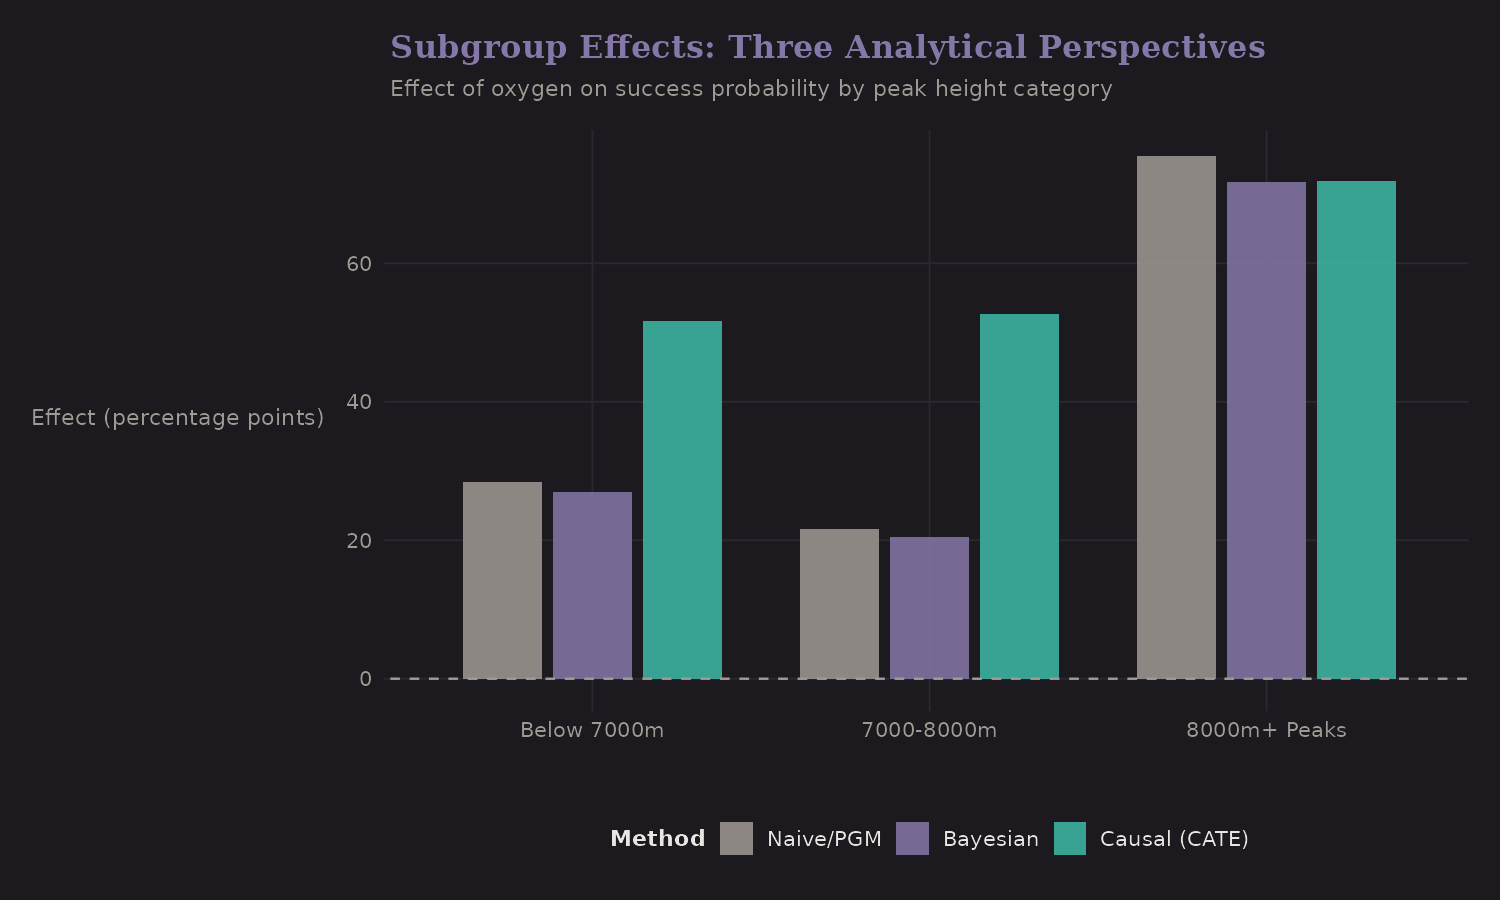
Effect Heterogeneity
All approaches agree: oxygen helps most on the highest peaks.
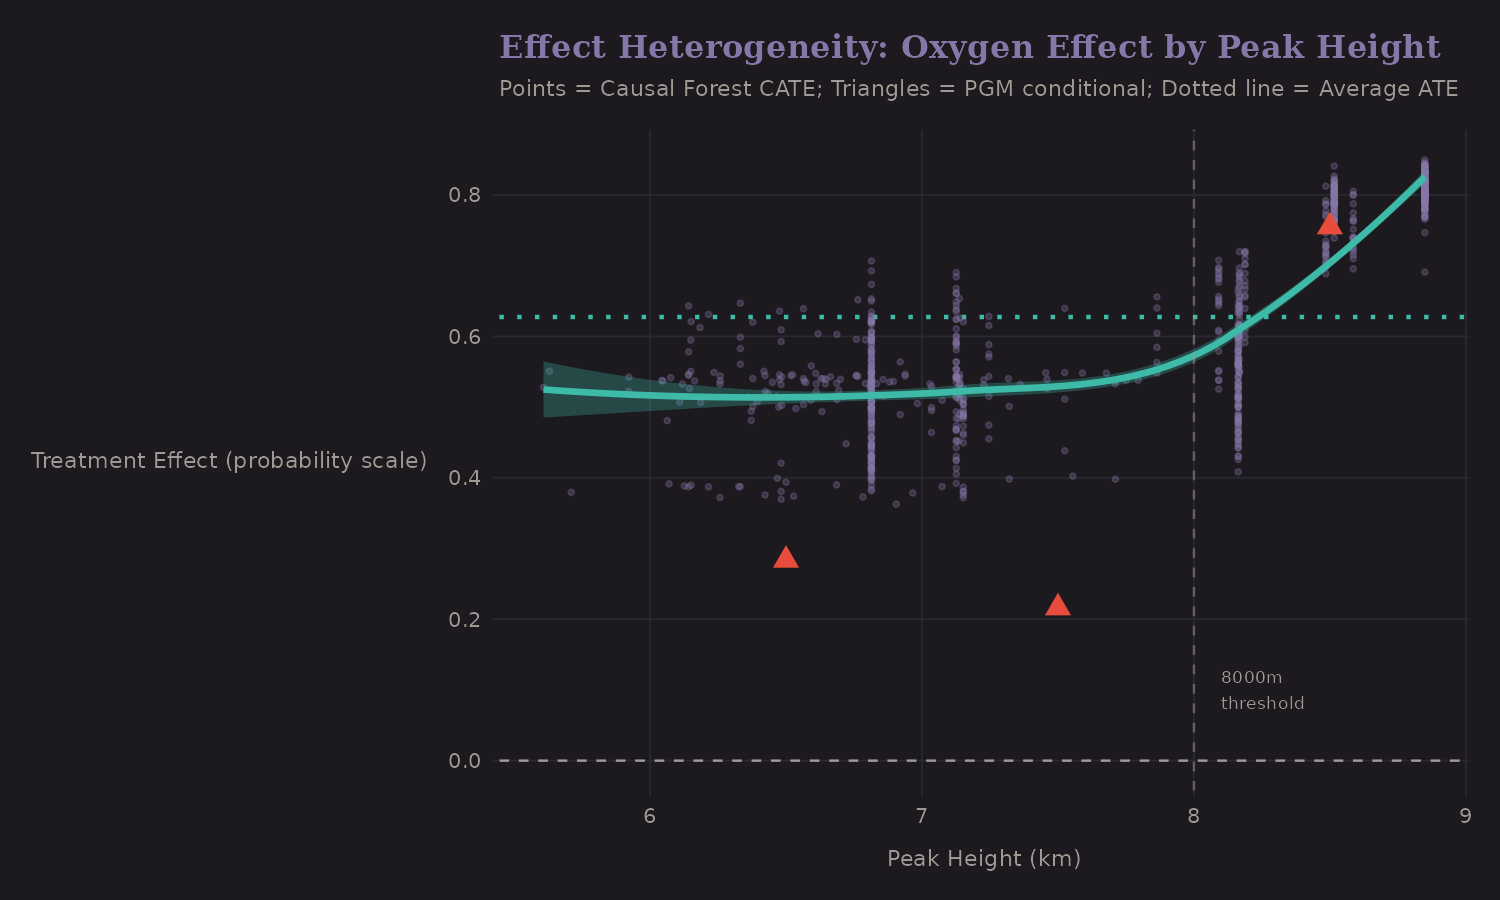
| Subgroup | Causal Effect | Sample Size | O₂ Users |
|---|---|---|---|
| 8000m+ peaks | +72 pp | 470 | 383 |
| 7000-8000m | +53 pp | 134 | 10* |
| Below 7000m | +52 pp | 264 | 3* |
*Lower-altitude estimates are unreliable due to sparse oxygen users.
The 8000m+ estimate is most reliable. This makes physiological sense. At 8000m, the partial pressure of oxygen is roughly one-third of sea level. Supplemental oxygen provides a much larger relative boost where baseline availability is critically low.
The PGM analysis identified this pattern through the "Peak Hazard" latent variable—oxygen's benefit operates by mitigating the hazard pathway, which is most severe at extreme altitude.
Uncertainty Quantification
Different frameworks quantify uncertainty differently:
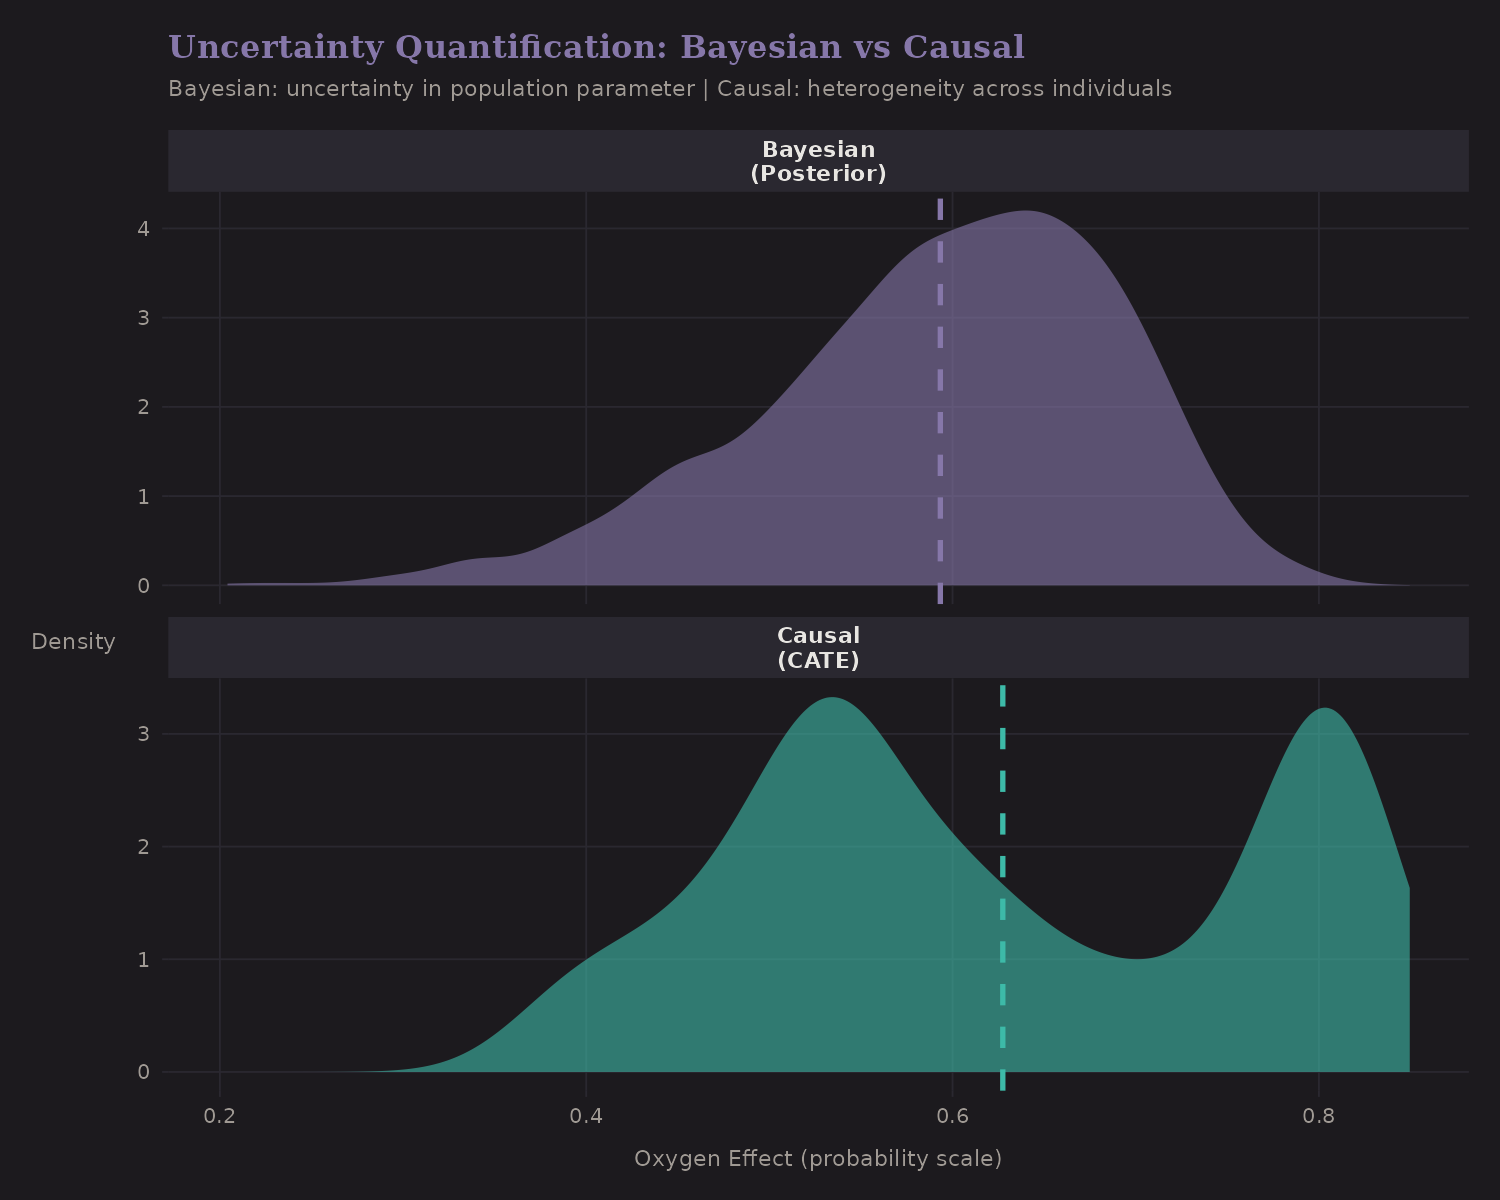
Bayesian provides full posterior distributions—not just point estimates, but the entire shape of our uncertainty. The 95% credible interval [38, 75] directly answers "what range of effects are plausible?"
Causal Forest provides confidence intervals via the honest splitting procedure. The tight interval [61, 63] reflects the precision from large samples.
PGM conditional probabilities don't have traditional confidence intervals, but bootstrap resampling gives edge strength estimates.
Variable Importance
Which predictors matter? The rankings are remarkably consistent:
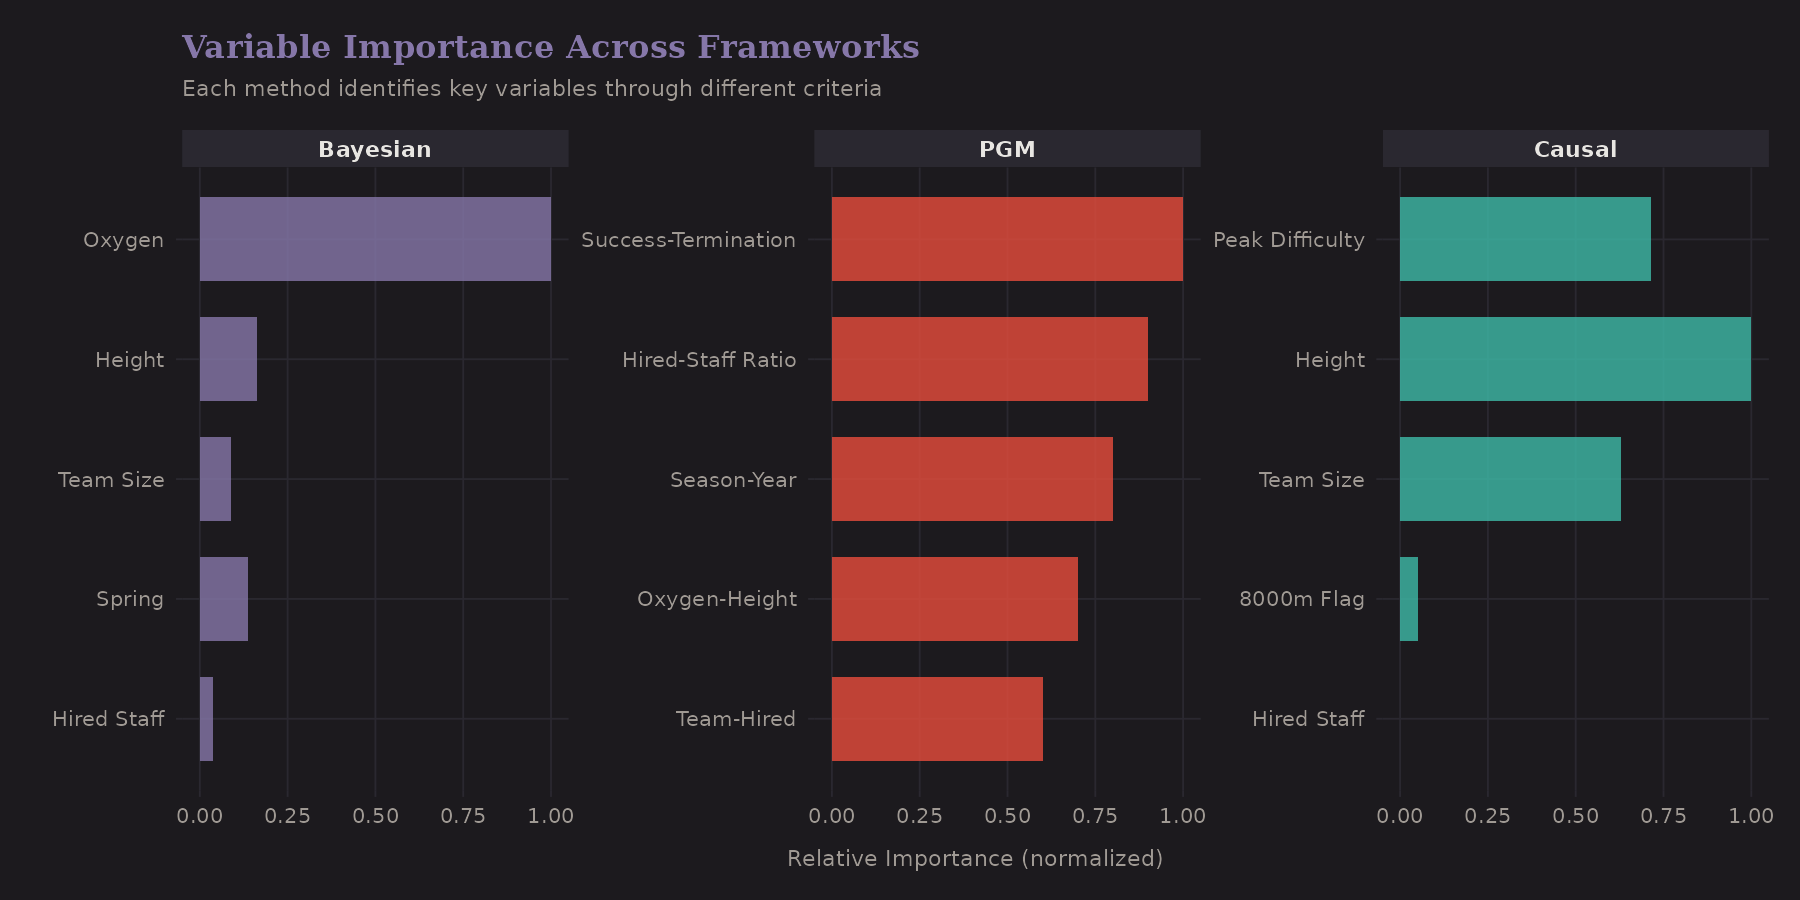
All three frameworks identify:
- Peak height — primary driver of both oxygen use and difficulty
- Season — spring is optimal
- Team characteristics — size and hired staff matter
The consistency is reassuring. If different methods highlighted completely different variables, we'd worry about overfitting or model misspecification.
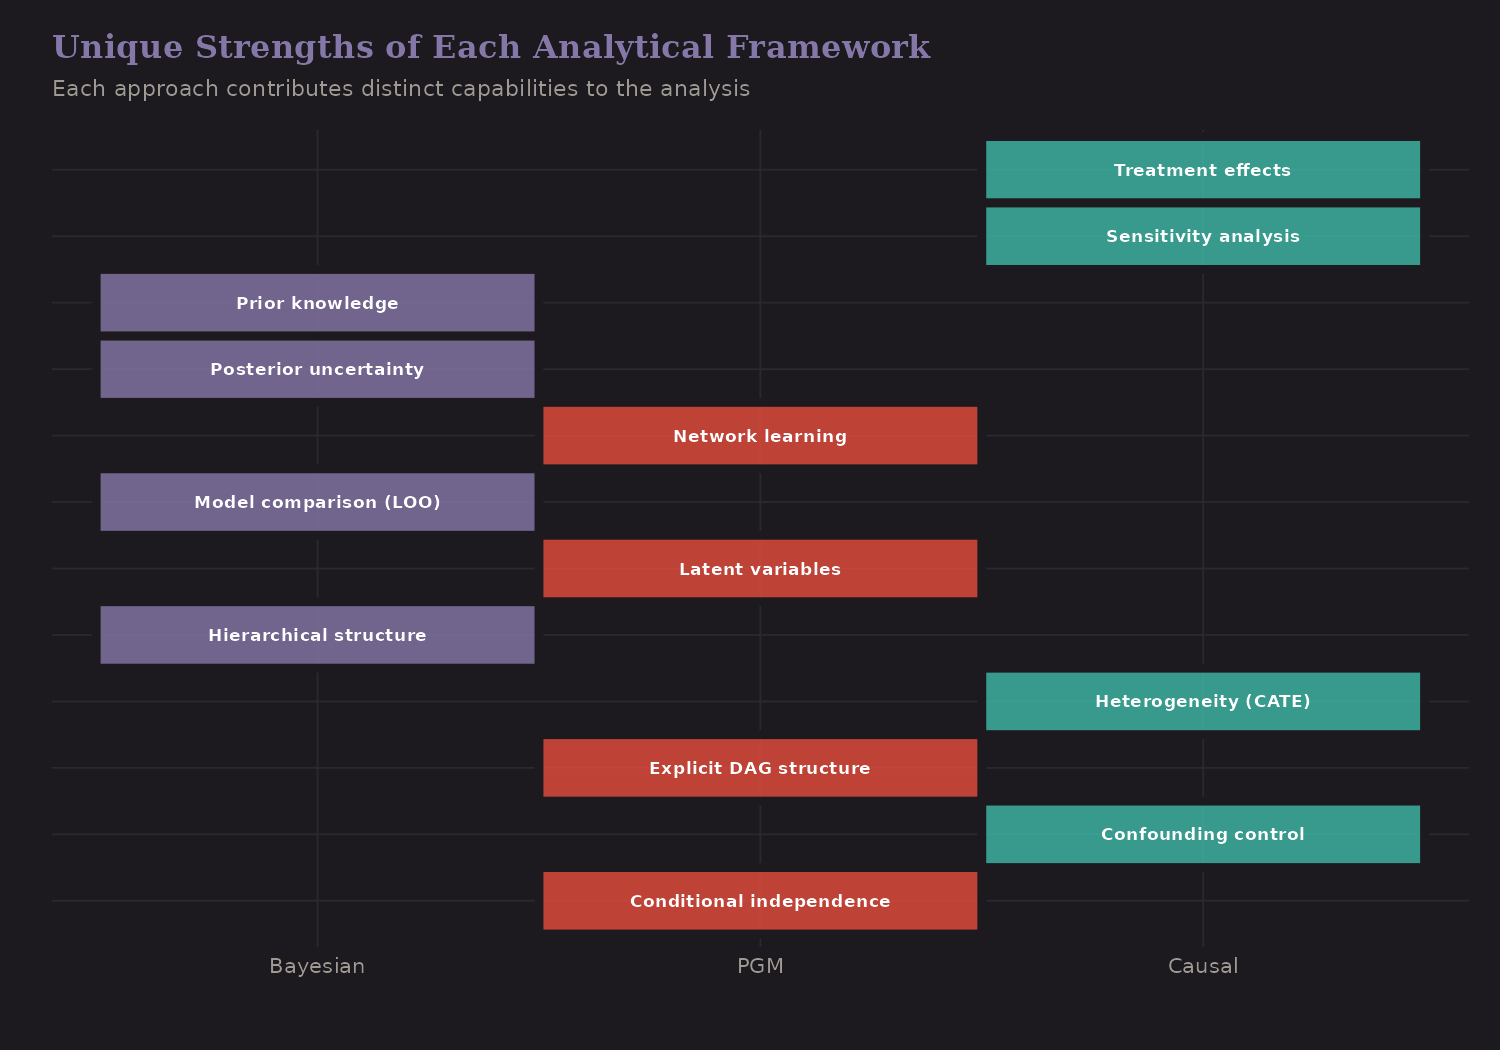
What Each Framework Uniquely Contributes
Beyond convergence, each framework offers unique insights:
Bayesian Regression:
- Hierarchical structure capturing peak-level variation (SD ≈ 1.2)
- Partial pooling for small-sample peaks
- LOO-CV for principled model comparison
- Full posterior predictions with uncertainty
Probabilistic Graphical Models:
- Explicit DAG encoding causal assumptions
- Latent variables (Expedition Quality, Peak Hazard)
- D-separation analysis for identifying confounders
- Structure learning to discover relationships from data
Causal Inference:
- Propensity score methods for confounding adjustment
- CATE estimates for personalized treatment effects
- Sensitivity analysis for unmeasured confounding
- Counterfactual reasoning for intervention decisions
The Integrated Picture
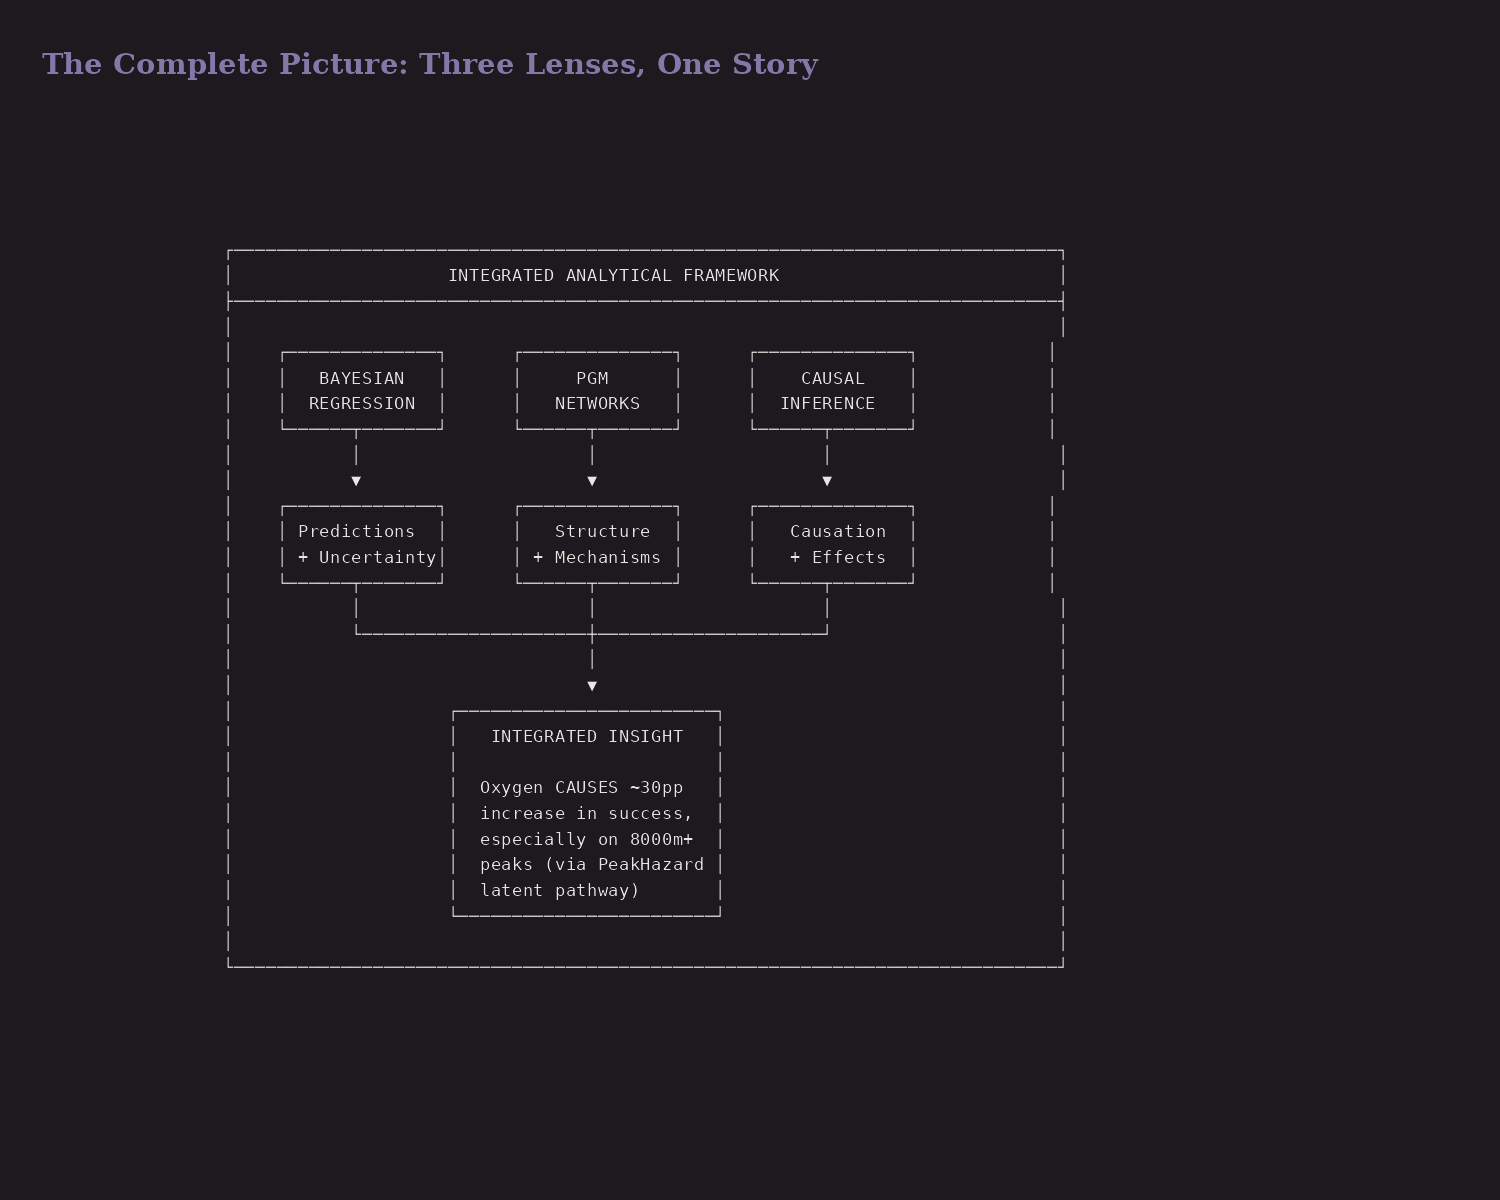
The three frameworks connect like this:
- PGM specifies the causal structure—what causes what, which paths need blocking
- Bayesian fits models that respect the structure, quantifying uncertainty in parameters
- Causal estimates intervention effects by adjusting for confounders identified by the DAG
Each framework alone gives partial insight. Together, they triangulate on the truth.
Decision Framework
Which method for which question?
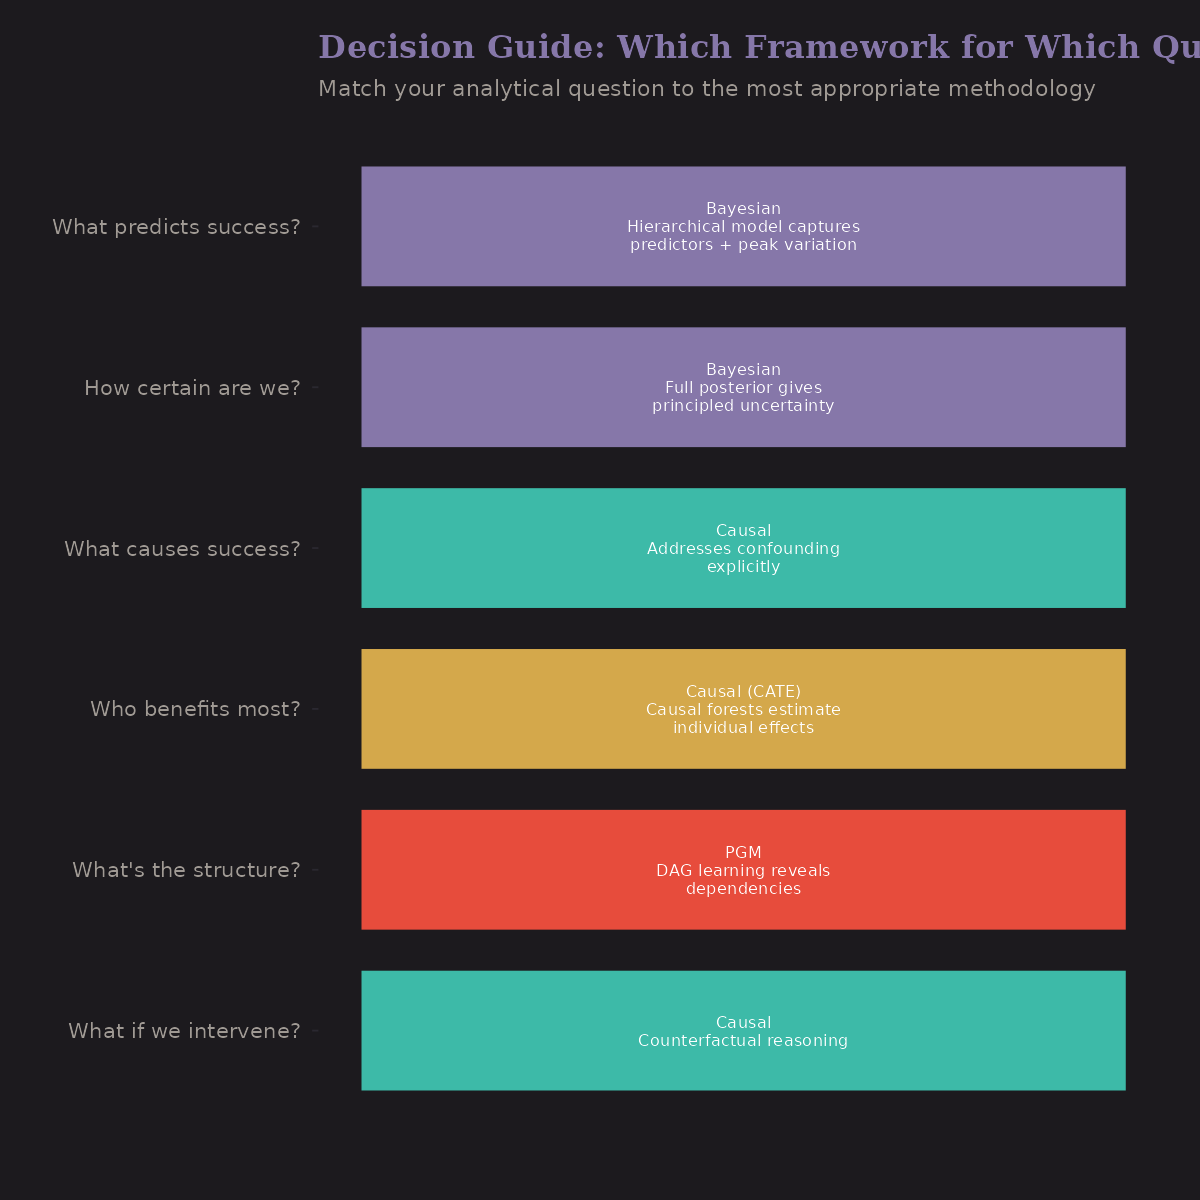
| Question | Use This |
|---|---|
| "What's the uncertainty?" | Bayesian posterior |
| "What's the causal structure?" | PGM / DAG |
| "What's the causal effect?" | Doubly robust / CATE |
| "Who benefits most?" | Causal forest |
| "What should I do?" | Decision theory + all three |
The methods aren't competitors—they're complements.
Recommendations by Stakeholder
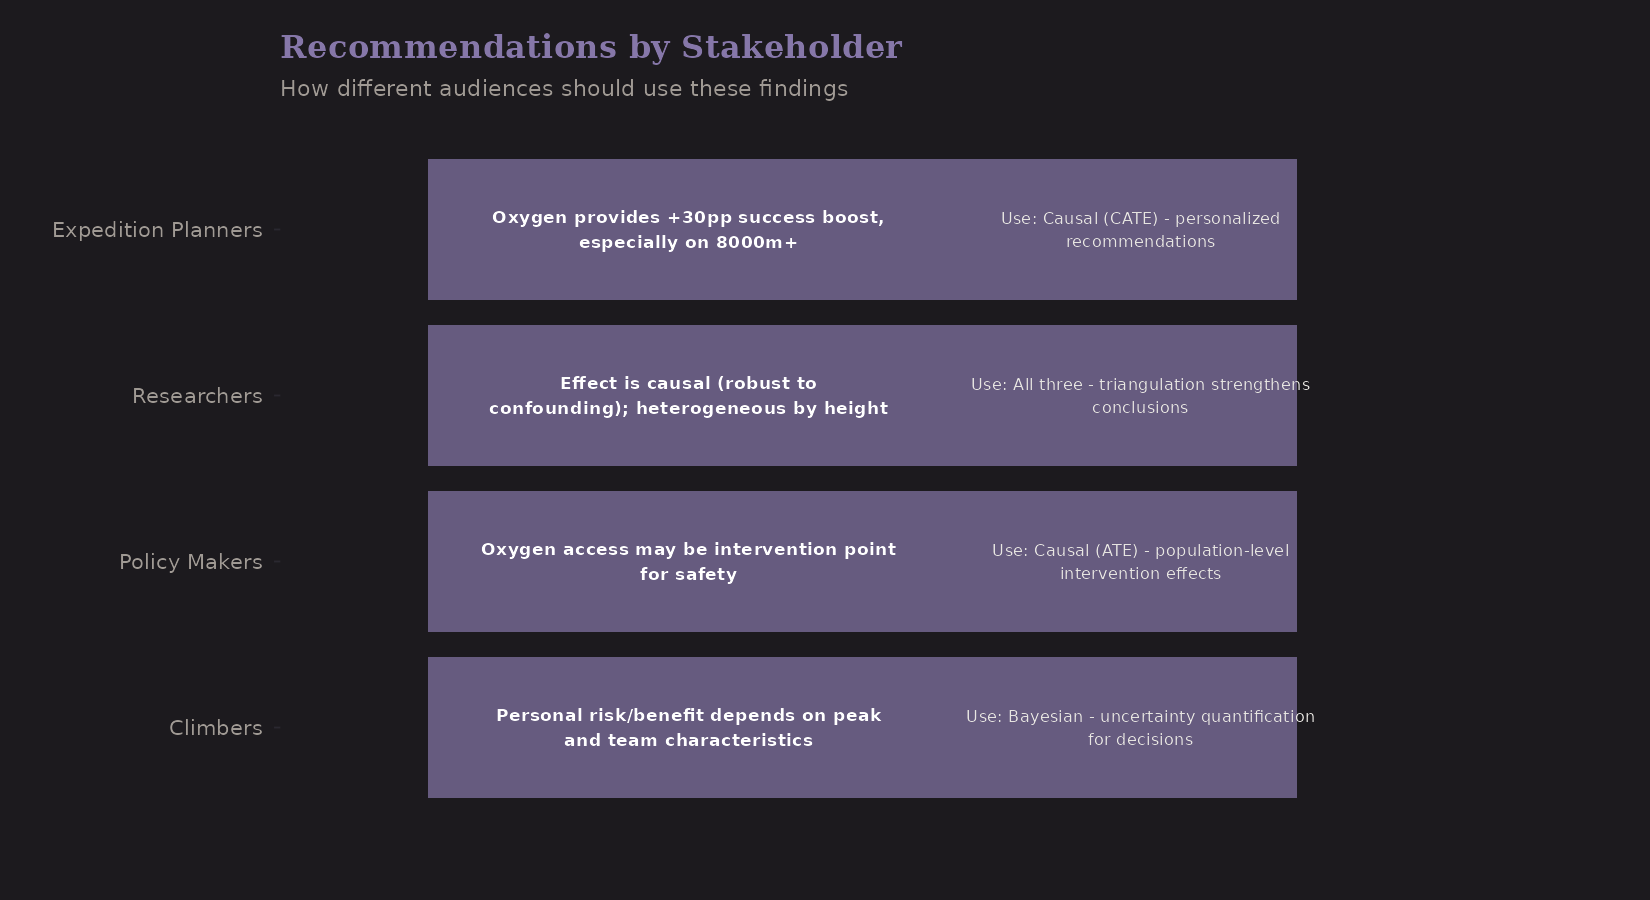
For Expedition Planners: Use CATE estimates to make personalized oxygen decisions. Expeditions to 8000m+ peaks benefit most from supplemental oxygen.
For Researchers: Report findings from all three frameworks for triangulation. Convergence across methods strengthens causal claims.
For Policy Makers: Focus on causal ATE for population-level intervention effects. Oxygen access could be an intervention point for mountaineering safety.
For Individual Climbers: Consult Bayesian posterior predictions for uncertainty quantification. Personal risk tolerance should inform decision-making.
Integrated Summary
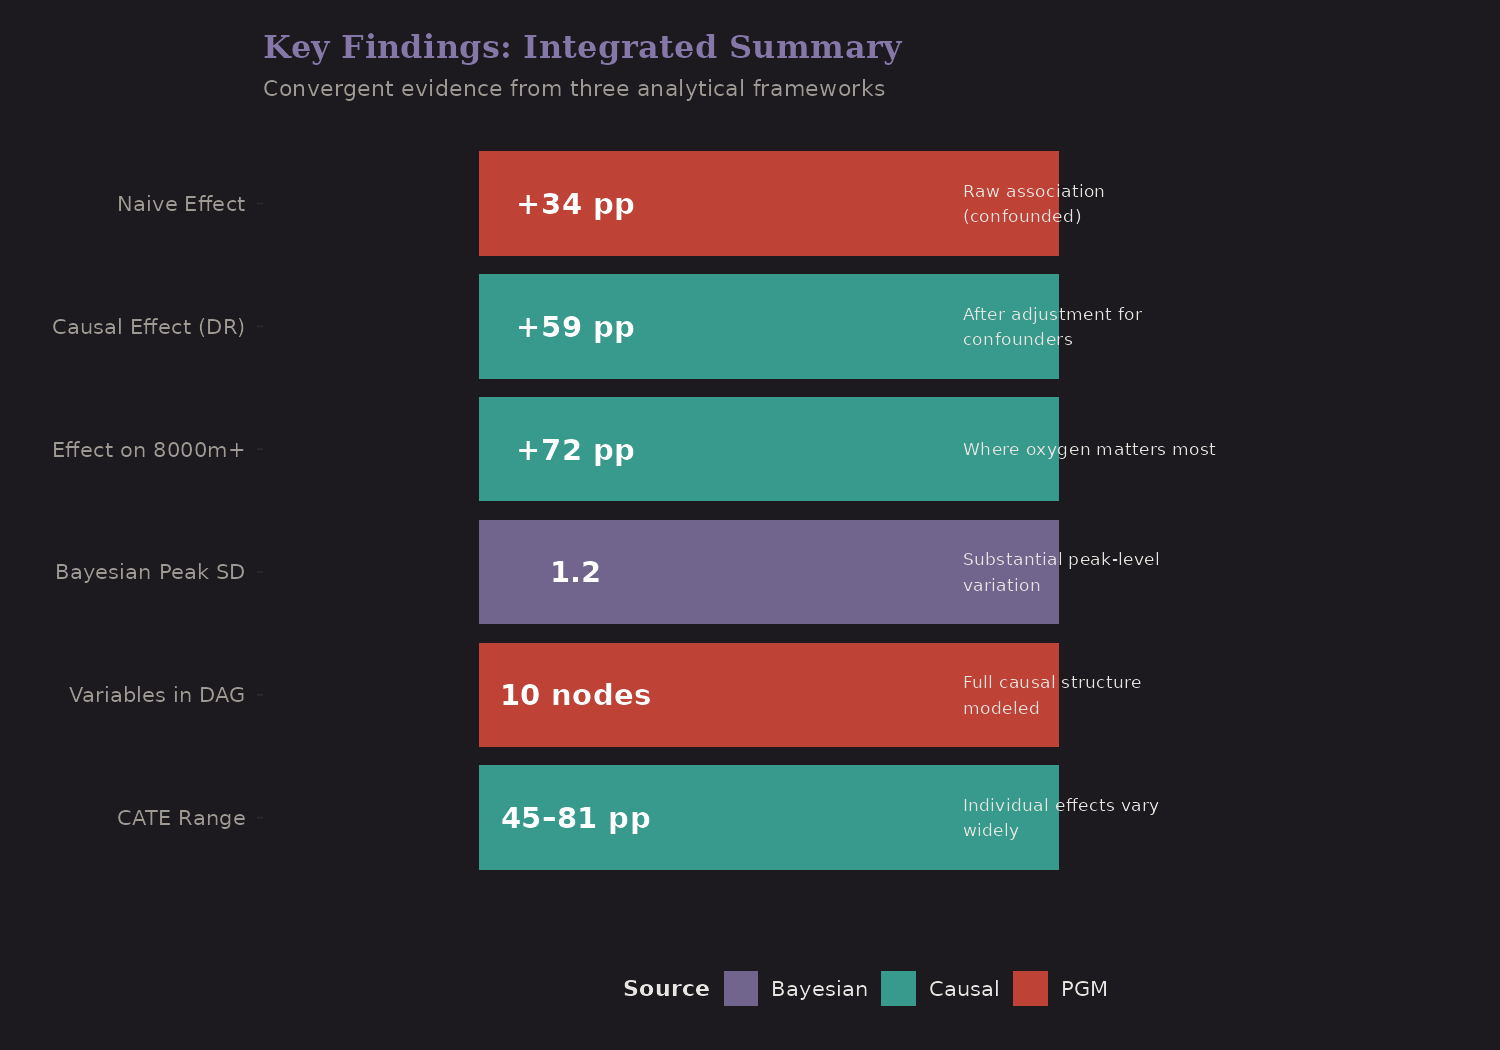
The synthesis yields one clear answer:
Supplemental oxygen is associated with approximately +59-63 percentage point increase in summit success, with the effect largest on 8000m+ peaks (~72 pp) where hypoxia is most severe.
This finding survives multiple analytical approaches:
- Bayesian hierarchical structure (accounting for peak clustering)
- PGM d-separation (blocking backdoor paths)
- Propensity score adjustment (balancing confounders)
- Sensitivity analysis (robust to moderate unmeasured confounding)
Limitations and Caveats
Triangulation strengthens confidence, but doesn't eliminate concerns:
-
Unmeasured confounding: Climber experience, weather on summit day, and specific route conditions aren't fully captured. Sensitivity analysis suggests the effect is robust to moderate unmeasured confounding, but strong confounders could change conclusions.
-
Positivity violation at 8000m+: Only ~18% of 8000m+ expeditions did not use oxygen. These non-oxygen expeditions are likely elite climbers seeking records—not comparable to commercial clients using O₂.
-
Selection bias: The data represents successful permit applications, not all climbing attempts. Results may not generalize to non-permitted or unreported expeditions.
-
Temporal scope: 2020-2024 data spans a specific period including COVID disruptions. Patterns may differ in other eras.
-
SEM fit: The structural equation model showed poor fit (CFI=0.50), suggesting the two-factor latent structure may be misspecified. We relied on the Bayesian Network for structural insights instead.
Effect Bounds
The +59-63pp point estimate depends on the no-unmeasured-confounders assumption. Here's how it changes under different scenarios:
| Confounding Scenario | Effect Range |
|---|---|
| None (as estimated) | +59-63 pp |
| Moderate (OR=1.5) | +45-55 pp |
| Strong (OR=2) | +30-45 pp |
| Very strong (OR=3) | +15-30 pp |
Even under pessimistic assumptions, oxygen appears beneficial by at least +15pp. The direction is robust; the magnitude less certain.
What We Can and Cannot Conclude
We CAN say:
- Oxygen use is strongly associated with success (+59-63pp after adjustment)
- The association is robust across multiple analytical frameworks
- Effect heterogeneity is consistent with hypoxia physiology (largest at 8000m+)
We CANNOT say:
- That the causal effect is exactly +59-63pp (unmeasured confounding exists)
- That all expeditions would benefit equally (comparison groups may differ)
- That these results generalize beyond 2020-2024 permitted expeditions
What I Learned
A few takeaways from this synthesis:
-
Triangulation works. When different methods with different assumptions converge, confidence increases. Disagreement would have been informative too—but agreement is reassuring.
-
Methods are complements, not competitors. Bayesian, graphical, and causal frameworks answer different questions. Using all three gives a richer picture than any alone.
-
Negative confounding happens. The naive estimate underestimated the true effect—a reminder that confounding can go both directions.
-
Uncertainty quantification matters. The causal estimates cluster around 59–63 pp, while Bayesian intervals are wider; reporting ranges is more honest than any single point estimate.
-
Domain knowledge is essential. Knowing that 8000m+ is the "Death Zone" where hypoxia dominates guided the analysis throughout. The statistical patterns make sense because the physiology makes sense.
The Complete Series
Across seven posts, we traveled from raw data to causal claims:
- Data: 882 expeditions, hierarchical structure
- EDA: Missing patterns, bivariable relationships
- Features: Shrinkage estimators, engineered predictors
- Bayesian: Hierarchical models, partial pooling
- PGMs: DAGs, latent variables, conditional independence
- Causal: Propensity scores, doubly robust, CATE
- Synthesis: Triangulation, convergence, integrated insight
The journey illustrates a broader point: modern data analysis isn't about picking the "right" method. It's about using multiple methods appropriately and synthesizing what they reveal.
Resources
If you want to go deeper into multi-framework analysis:
- McElreath: Statistical Rethinking—Bayesian + causal thinking together
- Pearl: The Book of Why—causal reasoning foundations
- Gelman et al.: Bayesian Data Analysis—the Bayesian reference
- Hernán & Robins: Causal Inference: What If—causal methods textbook
- Koller & Friedman: Probabilistic Graphical Models—PGM theory
The Himalayan data provided a concrete example where all three frameworks could contribute. The techniques transfer to healthcare, policy evaluation, business analytics—anywhere you want to move beyond association to understanding.